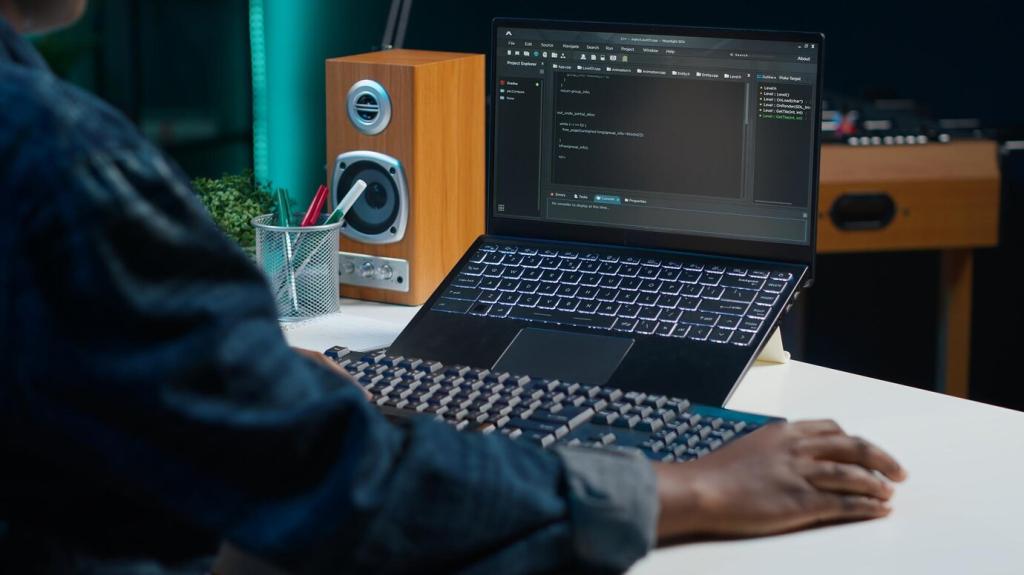
Mobile App Performance Optimization Tools: Build Speed Your Users Can Feel

Chosen theme: Mobile App Performance Optimization Tools. Welcome to a hands-on, story-rich guide that turns slow taps into instant smiles. Explore the tools, workflows, and small decisions that create fast, reliable, battery-friendly experiences users never want to quit.

Xcode Instruments and Time Profiler

Use Time Profiler to pinpoint hot paths, visualize call stacks, and quantify milliseconds lost to inefficient loops. Pair with Allocations and Energy Log to spot retain cycles and power-heavy code. Comment with your favorite Instruments template that saved a release.

Android Studio Profiler and Perfetto Traces

Android Studio Profiler maps CPU, memory, and network events, while Perfetto captures system-wide traces for frame pacing and scheduling insights. We once cut cold start by 42% after Perfetto exposed a blocking I/O call. Share your most surprising trace discovery.

Flipper, Systrace, and Custom Signposts

Flipper’s plugins highlight network timings and layout issues, while Systrace surfaces jank sources across threads. Add custom signposts or OSLog points to contextualize slow edges. Subscribe for templates that standardize trace markers across your team and platforms.

Network Optimization and Inspectors

Record sessions, throttle bandwidth, and rewrite responses to simulate outages. These tools reveal duplicated calls and wasted headers. We discovered a 700 KB JSON array requested twice per screen. Subscribe for rulesets that instantly surface anti-caching mistakes.

Network Optimization and Inspectors

Measure real throughput with iPerf and practice degraded modes using throttling profiles. Your app should feel composed under 2G and airplane mode handoffs. Comment with your favorite strategy for prefetching while staying respectful of battery and user data limits.

Network Optimization and Inspectors

Validate multiplexing effectiveness, TLS session reuse, Brotli or gzip compression, and protobuf efficiency. Watch for HOL blocking patterns and server settings that negate client wins. Tell us which server hint or cache-control header gave you the largest perceived speedup.

Startup and Rendering Speed

Instrument the launch path with signposts to isolate expensive initializers, dynamic linking costs, and main-thread I/O. MetricKit aggregates launch metrics post-release. Share if you ever moved feature gates post-first frame to delight users without sacrificing stability.

Startup and Rendering Speed

Use Startup Tracing to spot lazy vs eager initialization opportunities and employ JankStats to tag UI slowdowns to specific screens. We shaved 180 ms by deferring logging setup. Subscribe for a checklist that trims startup without risking crash-on-first-tap.

Memory, Images, and Caching Discipline

Hunt leaks early with LeakCanary’s heap analysis and Xcode’s Memory Graph to reveal retain cycles and view controller leaks. A stubborn leak came from a closure capturing self. Follow for a pragmatic leak triage workflow that won’t stall your sprint.

Battery and Energy Profiling

Inspect wakeups, alarms, and job schedules, correlating with CPU bursts and network usage. We cut background drain by rescheduling syncs under Doze constraints. Subscribe for a checklist of power pitfalls and the instrumentation snippets that catch them early.

Battery and Energy Profiling

Energy Log surfaces hotspots across CPU, GPU, and networking, while MetricKit flags abnormal background activity. A misconfigured timer fired every second while idle. Comment if you have guidelines to align refresh intervals with user-visible value and battery health.

CI Guardrails, Benchmarks, and Release Confidence

Use Macrobenchmark for startup and scroll, Microbenchmark for hot functions, and Baseline Profiles to improve code layout for faster execution. We stabilized frame times before Black Friday. Follow for scripts that publish benchmark deltas as PR checks.

CI Guardrails, Benchmarks, and Release Confidence

Create XCTest performance tests that track median and p95, piping results into CI. Xcode metrics expose build times and test flakiness trends. Comment if tightening p95 budgets nudged your team into safer patterns and fewer main-thread experiments.
Skadinawjo
Privacy Overview

This website uses cookies so that we can provide you with the best user experience possible. Cookie information is stored in your browser and performs functions such as recognising you when you return to our website and helping our team to understand which sections of the website you find most interesting and useful.